The Hidden Economic Reality of America: A Poverty Analysis
Exposing the True Cost of Living Through Street Smart Intelligence
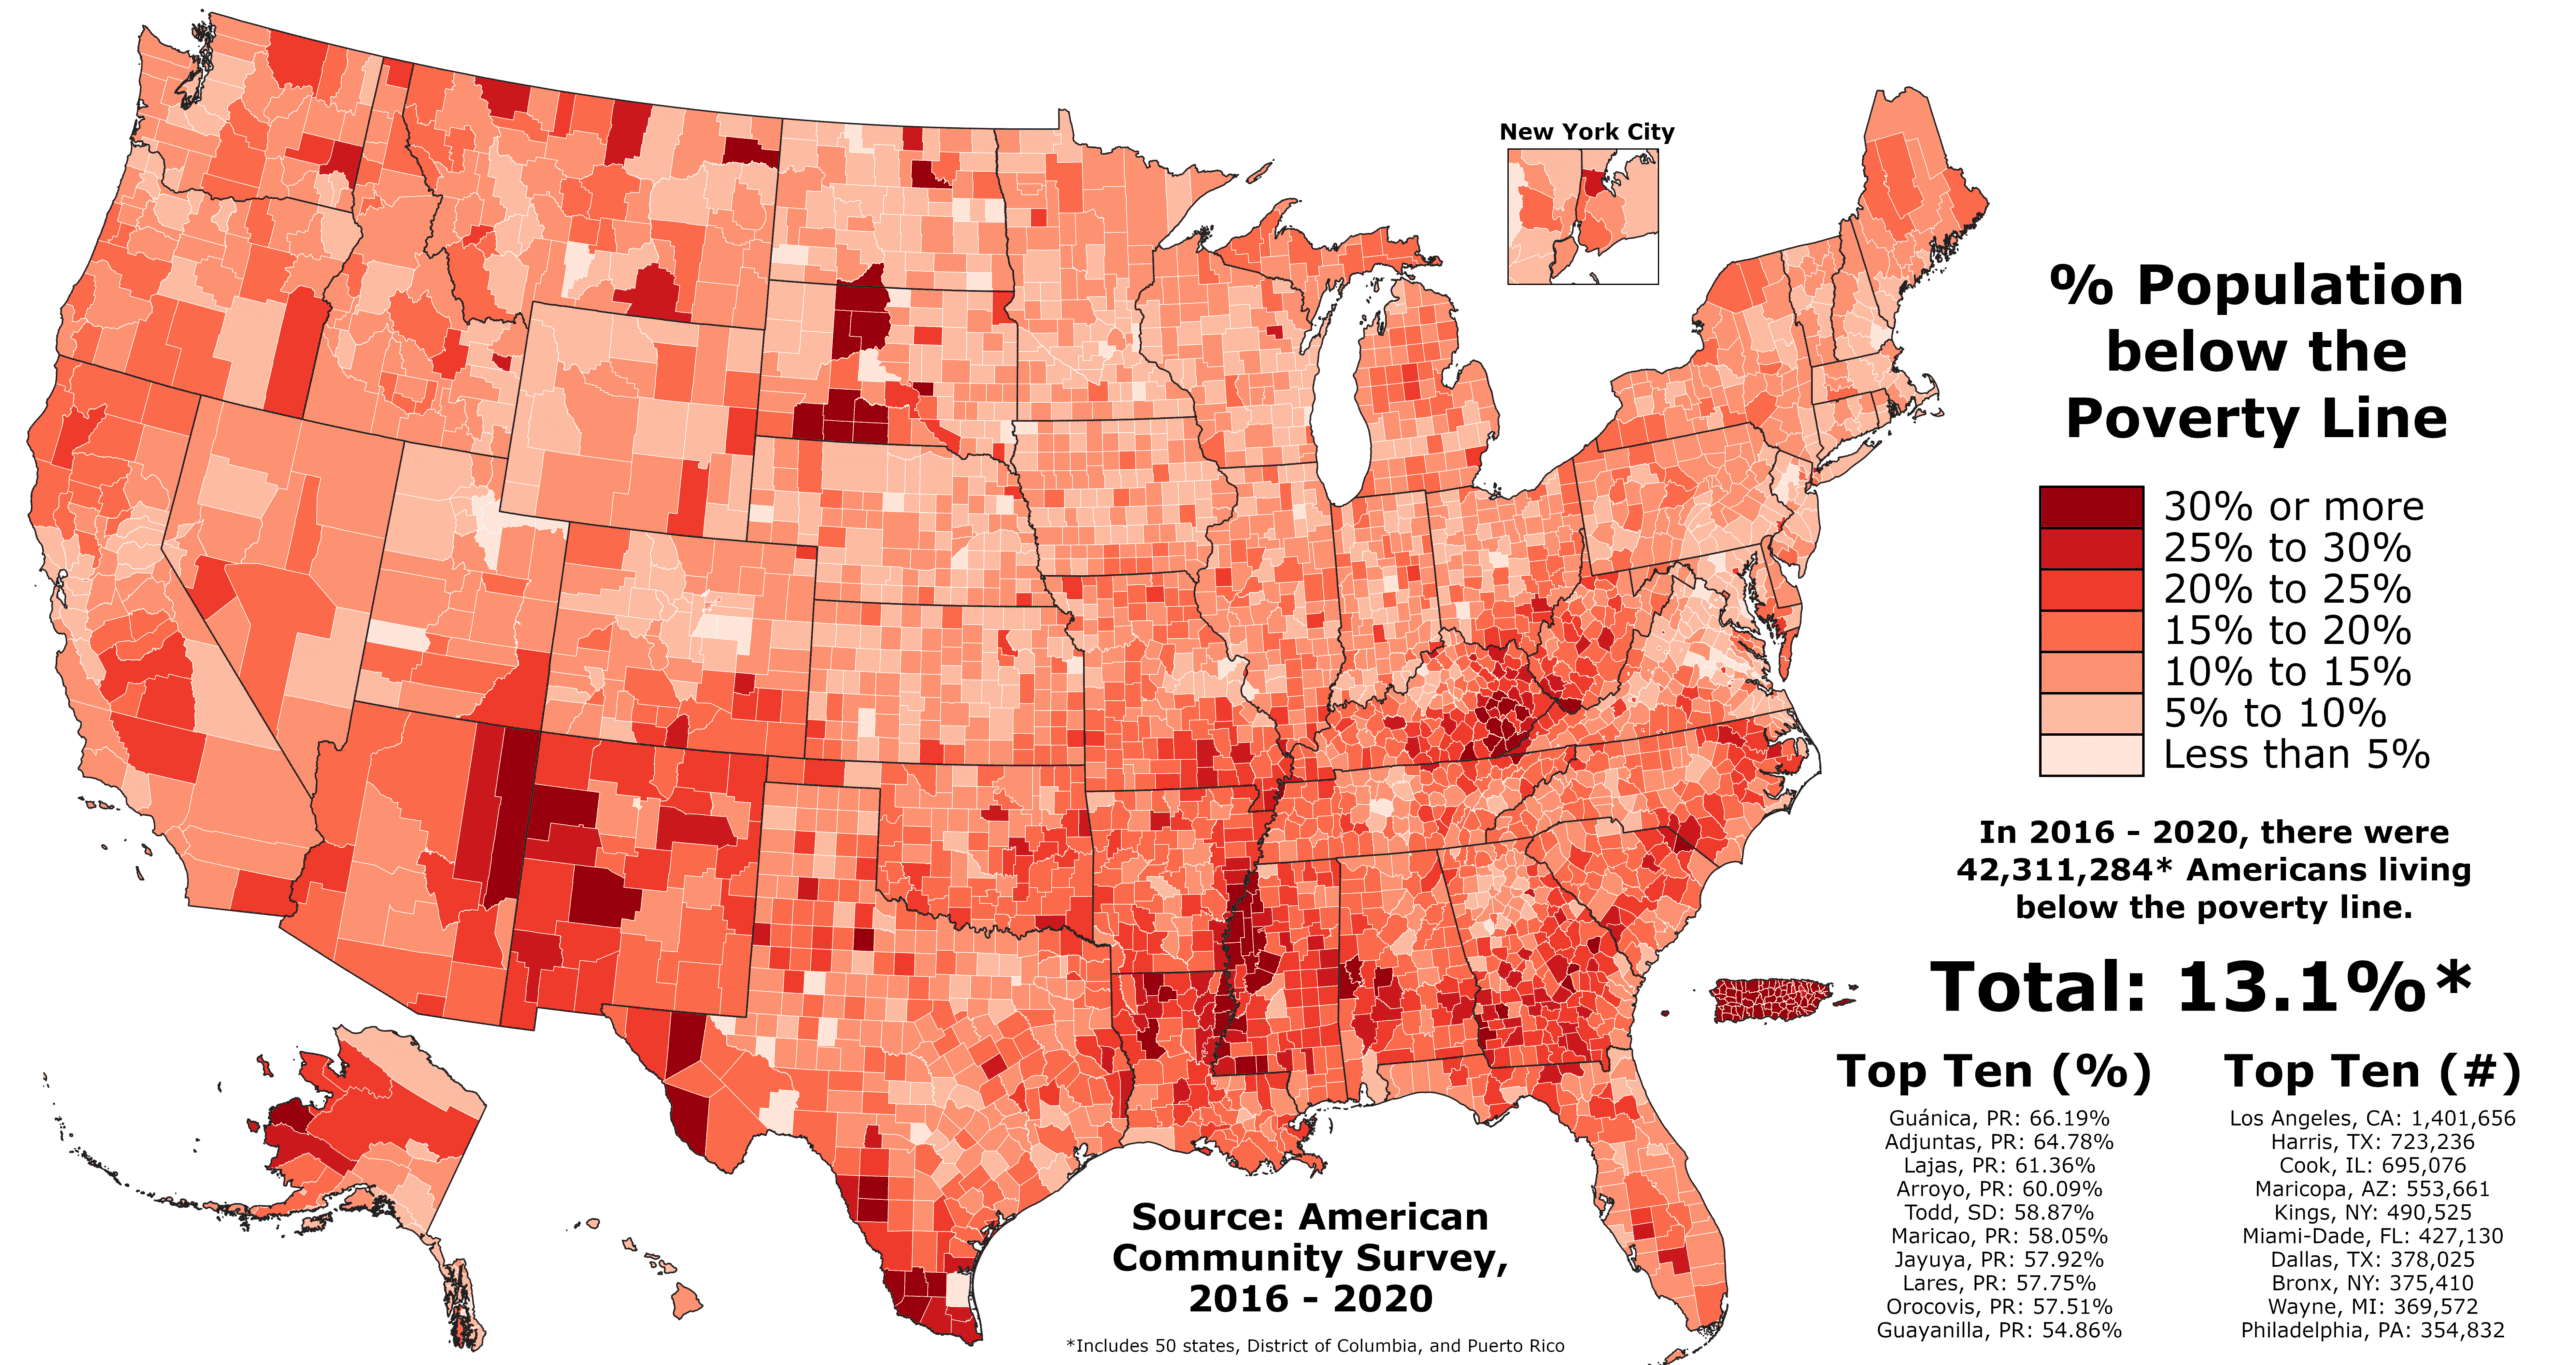
Through reverse-engineering U.S. demographic and tax data using food-price purchasing power parity (PPP) rather than official exchange rates, this analysis reveals that approximately 60% of Americans live in conditions that would be considered poverty-level by global purchasing power standards. The findings challenge conventional economic narratives and expose how statistical manipulations mask genuine economic distress.
Food-Price PPP vs. Official Exchange Rates
There is a Fundamental Flaw in Current Economic Analysis. Official Purchasing Power Parity calculations rely heavily on luxury goods (like iPhones) and broad market baskets that don’t reflect how ordinary people actually spend money. This analysis uses a more honest baseline: food prices.
Key Insight: In India, ₹60-100 purchases the equivalent of $8-12 USD worth of food. ₹88 the official exchange rate as of August 2025 does not reflect real food prices. 1:10 ratio difference reveals how official metrics systematically overstate American purchasing power.
Real-World Validation: The Washington Post offers its subscription in India for under $12 annually—a price that would be impossible if official PPP calculations reflected actual purchasing power. Prices of daily food consumption items like eggs, milk, bread, pizza, butter and cheese etc. show the same pattern. USA is ten times more expensive. (See reference table at the bottom)
The Baseline Comparison with India
A domestic worker (Maid) in urban India earns approximately ₹30,000 monthly ($342 at official rates, but $3,000 in actual monthly purchasing power using food-price PPP). Remember the Maid works part time in several homes and is considered the lowest level of employee’s hierarchy in unorganized sector. This means:
- Shocking Reality: An Indian domestic worker has more real purchasing power than Americans earning $25,000-30,000 annually
- This equals roughly 30-40% of American workers
The Demographic Data Analysis
Population Concentration Crisis
The 3% Urban Reality:
- 80% of Americans (265 million people) live on just 3% of the nation’s land
- Average urban population density: 2,552 people per square mile
- This extreme concentration artificially inflates all costs
Economic Implications:
- Housing costs skyrocket due to artificial scarcity
- Food prices increase due to transportation and real estate costs
- Infrastructure strain increases municipal costs
- Competition for resources drives up all basic necessities
The Tax Filing Reality Check
Key Statistics:
- Total U.S. Population: 332 million
- Tax returns filed (2023): 161.4 million
- Non-filers: ~168 million (children, dependents, low-income earners)
- Filing threshold for singles: $14,600 (essentially poverty level)
Rational conclusion: The filing threshold itself represents near-poverty conditions. Yet even those required to file often pay zero taxes due to the standard deduction, revealing how many “taxpayers” are actually struggling financially.
Income Distribution Reality
The America’s economic well being is in 60/30/10 breakdown:
- 60% “Barely Making It” (Real Poverty Level)
- Includes the bottom 50% of taxpayers earning under $46,500
- Using food-price PPP, this represents genuine economic distress
- Many live paycheck-to-paycheck despite “middle class” statistical classification
- 30% “Comfortable but Not Rich”
- Middle-tier taxpayers with some discretionary income
- Still vulnerable to economic shocks
- Limited real wealth accumulation
- 10% “Genuinely Affluent”
- Bear significant tax burden (top 1% pay 26% of all federal taxes)
- Have true economic security and wealth accumulation
- Possess real purchasing power by global standards
The Geographic Trap
Why Americans Can’t Escape High Costs? Unlike other countries where people can relocate to lower-cost areas, Americans face a cruel geographic reality. They have barely ten cities with over a million population and these are the economic centers.
The Economic Concentration Problem:
- Jobs concentrated in expensive urban areas (3% of land)
- Rural areas (97% of land) economically isolated
- Moving to lower-cost areas means unemployment
- Result: Economic imprisonment in high-cost zones
Comparison with India:
- If Mumbai becomes too expensive, opportunities exist in Thane, or smaller cities
- Cost arbitrage possible while maintaining employment
- Americans lack this flexibility
The AI Censorship Phenomenon
AI’s Refusal to Engage: During the original research, AI repeatedly refused to address direct questions about American economic wellbeing, stating various policy restrictions. This pattern suggests:
- Algorithmic Bias: AI systems may be programmed to avoid uncomfortable economic realities of USA.
- Corporate Sensitivity: Tech companies may suppress analyses that challenge American economic narratives.
- Information Control: Potential systematic suppression of critical economic analysis of USA economy.
The Questions That Were Ducked:
- Direct assessments of American living standards
- Comparative purchasing power analysis
- Real-world economic impact discussions
The Tax Burden Reality
The Exploitive System of taxation: Americans face multiple layers of taxation that compound their economic stress:
- Federal Income Tax: Progressive rates up to 37%
- Payroll Taxes: Social Security and Medicare contributions
- State Income Taxes: Additional 0-13% in many states
- Property Taxes: Built into rent costs
- Sales Taxes: On most purchases
- Gasoline Taxes: Essential for transportation
- Various Fees: Vehicle registration, licensing, etc.
The Poverty Tax Paradox: Even those earning near-poverty wages must navigate this complex system, with filing requirements beginning at $14,600—barely above official poverty thresholds.
Global Purchasing Power Reality
The iPhone Fallacy: Official PPP calculations use luxury goods like iPhones that sell at similar prices globally. However:
- Luxury goods ≠ Daily necessities
- Food, housing, and basic services follow different economic rules
- Official metrics systematically overstate American purchasing power
Media Pricing as Evidence
The Washington Post Example:
- U.S. subscription: ~$100+ annually
- India subscription: ₹999 annually ($12 at official rates, but $120 in real purchasing power)
- This reveals a true pricing ratio closely matching 1: 10 food-price PPP calculations
- Corporate pricing strategies inadvertently validate real purchasing power differences
Implications and Conclusions
The Hidden American Crisis
This analysis reveals that America faces a hidden economic crisis masked by statistical manipulation and official narratives:
- Majority Economic Distress: 60% of Americans live with purchasing power equivalent to poverty-level conditions by global standards
- Geographic Imprisonment: Urban concentration creates inescapable high-cost environments
- Statistical Deception: Official economic metrics systematically overstate American prosperity
- Information Suppression: AI systems appear programmed to avoid acknowledging these realities
Recommendations for Further Research
- Independent Economic Analysis: Develop food-price PPP measurements for global economic comparison
- Geographic Economic Studies: Analyze the true cost of America’s urban concentration model
- AI Bias Investigation: Examine systematic suppression of critical economic analysis by major AI platforms
- Alternative Economic Metrics: Create new measurements that reflect real purchasing power rather than statistical abstractions
Data Sources:
- U.S. Census Bureau demographic data
- IRS Statistics of Income division
- Bureau of Labor Statistics employment data
- Cross-cultural food pricing analysis
- Cross comparison of prices from vending websites.
PS: The Moment of Realization
This analysis emerged from a conversation with AI, which repeatedly refused to address direct questions about American economic well being. It would stick to official line of poverty being less than 12%. The methodology presented here uses publicly available demographic, tax statistics, income data and food-price purchasing power parity to reveal uncomfortable truths about American living standards.
It made me to literally “sit up in bed” upon discovering that 80% of Americans live on just 3% of the land area and half of them are earning what amounts to poverty-level purchasing power by global food-price standards. Poverty hidden in plain numbers.
“Sometimes the most profound insights come from outside observers who aren’t constrained by local statistical conventions and institutional biases.”
Reference Table of Comparative Prices:
| Item | India Price (INR / USD equiv.) | USA Price (USD) | Price Ratio (US:India) | Notes |
|---|---|---|---|---|
| Eggs (per dozen) | ₹68-80 (~$0.82-0.96) | $2.08-3.60 | 2.5-4x | India: Basic packs from groceries/street vendors. USA: Dropped to $2.08 (Aug 29) from July peak of $3.599; state highs up to $6+ (e.g., Nevada). |
| Milk (per liter/gallon equiv.) | ₹50-70/liter (~$0.60-0.84; ~$2.28-3.19/gallon equiv.) | $3.73-4.16/gallon | 1.5-2x (but gallon equiv. shows gap) | India: Fresh/local dairy. USA: Whole milk ads at $3.73 (recent), average $4.162 (July). |
| Bread (per loaf/400-500g) | ₹40-120 (~$0.48-1.44) | $1.85-3.06 | 2-6x | India: Basic white/whole wheat packs. USA: $1.851/lb (July), loaf average $3.06; regional highs $4-5. |
| Pizza (basic regular/small) | ₹49-99 (~$0.59-1.19) | $7.99-15 | 6-15x | India: Domino’s regular (e.g., Margherita) starts at ₹99. USA: Domino’s large one-topping ~$7.99; median plain cheese $7.25-15. |
| Burger (basic, e.g., veg/non-veg or Big Mac equiv.) | ₹50-80 (~$0.60-0.96, street) | $5.58-6.72 | 6-11x | India: Street food/basic fast food. USA: Big Mac average $5.79; state range $4.67-6.72, meals up to $8-10. |
| Street Meal (e.g., Chole Bhature or similar) | ₹50-80 (~$0.60-0.96, street); ₹150+ restaurant | $6-12 (equiv. fast food meal) | 6-20x | India: Street vendors keep it affordable; premium delivery 2-3x higher. USA: Comparable casual meal (e.g., burger combo) aligns with Big Mac meal prices. |